The fuel trim Parameter Identifiers (PIDs), both short term fuel trim (STFT) and long term fuel trim (LTFT), on your scan tool can provide much needed information when it comes to analyzing drivability problems quickly and efficiently. Fuel trim data is nothing more than the scan tool displaying what the engine computer is doing with the fuel injection pulse width to keep the air/fuel ratio where it needs to be.

Recap of Fuel Trim
Fuel trim is nothing more than the corrections in fuel injector pulse width that is made by the ECM (Engine Control Module). The fuel trims start with STFT, which is the product of the feedback from the oxygen sensors. As STFT is captured, the fuel trim correction is moved to LTFT, where it is stored in fuel trim cells. Here the LTFT data is stored in thetrim cell lookup tables so the ECM has the correct fuel trim data each time the engine speed or engine load is

changed.
The oxygen sensors will notice anything that alters the normal air mass or normal fuel mass entering the engine. These sensors will give their feedback to the ECM, the module will make a correction in the fuel injector pulse width and this goes on as long as the engine is running in closed loop. By using your scan tool to graph the fuel trim data, the technician can get a good direction on most any drivability problem.
Sitting in my bay is a nice looking 2006 Chevrolet Avalanche. The odometer shows the vehicle has traveled 135,000 miles, the engine is the popular 5.3 VIN Z flex fuel powerplant with an automatic transmission attached. The only complaint on the vehicle is the Check Engine light is illuminated. Test driving the vehicle uncovered no apparent drivability problems.
With a scan tool hooked up, three DTCs (Diagnostic Trouble Codes) were found in memory: P0101 (MAF circuit out of range), P0172 (system rich bank 1) and P0175 (system rich bank
The testing process
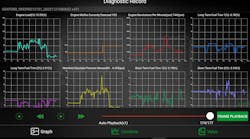
Data PIDs I’m recording on the test drive are engine RPM, throttle position (TPS), MAF grams per second, engine load, LTFT for both banks, STFT for both banks and oxygen sensor voltage for all four oxygen sensors. These few PIDs will give you all the needed information you need to analyze the problem and determine if the P0101 DTC is caused by a misreporting MAF sensor or not.
The vehicle was taken out and data captured at an idle, at a Wide Opent Throttle (WOT) acceleration up through one transmission shift, then at a short ¼ mile cruise. Because the test parameters are the same for all vehicles I diagnose, I have a preset route that allows for consistent results in a safe manner.
System analysis
Start the problem analysis with Figure 3, point No. 1, MAF data. The MAF data displays 6.67 G/S of airflow. A rule of thumb for MAF is, “with the engine at idle and all loads turned off, the air mass should equal 1 gram/second (G/S) per liter of engine displacement, at 500 rpm.”

Point No. 4, STFT is showing a negative 4 percent correction, so if we add the long term and short term fuel trim together to get total trim, the scan tool is showing a total negative 23 percent of injector pulse width correction. Point Nos. 4 and 5, oxygen sensor voltage, show the engine is running in closed loop and is in proper fuel control. This platform will stay in closed loop at all load conditions from idle through wide-open throttle.

Point No. 3, LTFT and STFT are both showing zero percent correction. This is normal, since the fuel enrichment is taken care of with the fuel enrichment strategies. Point No. 4, front oxygen sensor voltage is showing both banks above 900 millivolts, which is telling us there is plenty of fuel available during the maximum power demand the engine is under.


At wide-open throttle, the engine load is too low. I would expect to see 99 percent engine load, and the scan tool only displays 88 percent. This engine load is a product of the airflow being reported to the ECM.
During cruise, the total trim is a little out of line at negative 6 percent. There is one more test I would like to do, using a volumetric efficiency calculator as a tool, to see if the MAF is doing its job. This will be one more tool to help out with the MAF diagnostic process.


New MAF installed
With a new MAF sensor installed on the vehicle, the vehicle needs to be taken on its “after the repair” test drive. The same data should always be used to prove out the repair that was used to find the original problem. In this case, the recorded data has changed a little, one problem has been fixed, but there is still a problem that is shown in the fuel trim. Let’s examine the data and see what it tells us.


The cruise portion of the data found in Figure 9 tells a different story about the fuel/air ratio, with a total trim of negative 18 on bank 1 and a negative 15 on bank 2. One more test is needed,- we need to plug the scan data into the VE calculator and see how the results pan out.
The VE calculator in photo 10 shows the VE calculation of 86 percent, which is very good for this engine. This is evidence the new MAF sensor has fixed one problem, but there is still an over fueling issue lurking in the wings.
If this were a dribbling fuel injector, or fuel injectors, I would expect the fuel trim to be different between the two cylinder banks, and if it were a leaking fuel pressure regulator, I would expect to see the fuel trims very high at idle and lowering with the vehicle at cruise. This scan data is waving the flag of a fuel quality issue. I do not want to open the hood and connect a fuel pressure gauge; it’s cold outside and I want to find the problem in the comfort of the front seat.


This vehicle uses a virtual alcohol sensor where the oxygen sensors are used to make the fuel/alcohol calculations. Is there a possibility the misreporting MAF sensor has something to do with this miscalculation of the fuel/alcohol?

Searching service information, I found TSB 06-06-04-010E, which outlines this problem very well. An ECM reflash is required to fix the software problem that is causing the miscalculation of the fuel’s alcohol content. The reflash was performed, another four gallons of fuel was added to the fuel tank and the vehicle driven. Figure 12, points Nos. 1 and 2, shows the ECM running the fuel composition calculation. The first time the calculation was run, the system reported 25 percent alcohol.
The next data capture, Figure 13, was taken after two refueling events. The total fuel trims run around negative 4 percent and at point No. 1, the fuel/alcohol content is showing 25 percent alcohol content. I find this consistent with this vehicle platform. The fuel/alcohol content is always reported higher than what is measured in the tank. This causes the total fuel trim to run at a slight negative rate.
Learn to use your scan tool. It makes problems like this come to you and makes them easy to solve.